
Per a tongue-in-cheek note this past week to our StateSide Investors’ Roundtable, we apologized for single-handedly having “crashed” the precious metals’ markets with last Saturday’s missive (“Gold Fit to Pull Back a Bit”) following which on Monday — directly out of the chute — the yellow metal suffered its third-worst intraday high-to-low loss (-2.7% or -$62/oz.) in better than 14 months…

Too, Sweet Sister Silver’s simultaneous stint saw a -5.7% slam. Damn!
We nonetheless plead innocent for merely going with the math, a valued leading science which few anymore seem to do. For recently we’d written ad nauseum: “…near-term Gold is very over-extended; but broad-term Gold remains very undervalued…” And for you WestPalmBeachers down there, “near-term” plays out prior to “broad-term”, the former being exactly what Gold is now enduring, (i.e. ’tis going down). Or for those you scoring at home: mere math + historical repetition = leading knowledge. Hardly the “holy grail”, but given prudent cash management, ’tis on balance beneficial to one’s trading account. “Try it, you’ll like it!” –[Alka-Selzer, ’72].
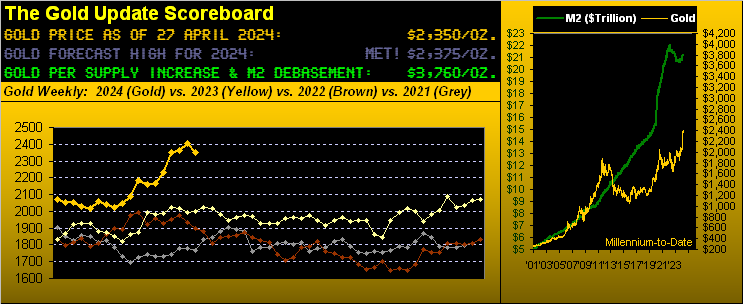
Oh to be sure, Gold through just the first third of this year has already achieved our forecast high of 2375, indeed reaching up to 2449, albeit price settled Friday below both of those levels at 2350. And whilst we’re on record to not upwardly re-forecast a revised target, we’d be surprised should Gold not trade higher still as the year unfolds, even if the Federal Reserve raises rates. ‘Course, you regular readers know we’ve be musing since the start of this year over the Fed actually needing to again raise rates, contra to the non-math parroting crowd’s having called for as many as three rate cuts during 2024, (such expectations having lately been reduced to just one cut toward the end of the year).
But even should the Fed dutifully raise, such move — as we’ve in the past shown — wouldn’t automatically deter Gold from moving higher. Recall the three-year stint from 2004 through 2006: the FedFundsRate rose 425 basis points … and Gold rose +69%.
Thus whilst Gold is positioned just fine (thank you very much), when it comes to the stock market, it seems as if we’re in a constant state of hand-holding. On days when the S&P 500 rises +1%, FinMedia responses range from neutral to happy. But toss in a -1% down day, and many-a-headline goes catastrophic:
- “Markets Roiled by FedSpeak!”
- “Markets Plunge on Powell!”
- “Markets Tumble on Earnings Trouble!”
Good grief. The telling optics are that the FinMedia folks today have no concept of “Roiled”, “Plunge” nor “Tumble”. They weren’t around in ’87, ’02, ’09, et alia. Reprise The Temptations from ’66: ![]() “Get Ready”
“Get Ready”![]() .
.
And although we’re not predicting what would be a third -50% “correction” in just this century for the S&P, by math (oh-no, say it ain’t so) the setup is sitting there:
- Neither earnings nor yield are supportive of price;
- Twice as much money is invested in the S&P than exists (by “M2”); and
- Risk-free dough pays triple the S&P’s yield.
Back in “our day”, a stock was purchased to benefit from a methodically rising price based on earnings generation — plus for high-quality companies — a dividend yield. Today, stocks are purchased on expectations of their quickly quadrupling. ‘Tis why we regularly term this “The Investing Age of Stoopid”. Have a nice day.
Meanwhile, although April has been a losing month for the S&P, ’tis been a good month for Gold, as you know price having reached an All-Time High of 2449 (at precisely 07:15 GMT on the 9th). And with but two trading days remaining in April, ’tis close enough to month-end to bring up our BEGOS Markets Standings essentially through this year’s first quadrimestris. Therein, red-hot metal Copper –which a month ago had been sixth in this stack — is now leading the pack (a sign of continued inflation expectations), having even surpassed Oil, with Gold still on the podium scantly ahead of what is undoubtedly a pouting Sister Silver, just one-tenth of a percent behind in fourth:
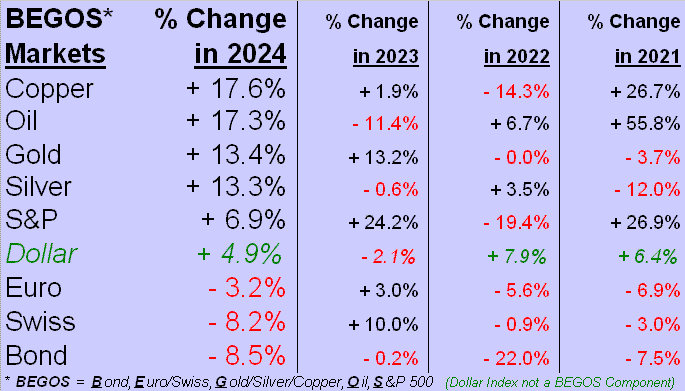
Too, from the “Gold Plays No Currency Favourites Dept.” note that despite the Dollar Index being +4.9%, Gold nonetheless is +13.4%. (Just because “That can’t happen”, ’tis).
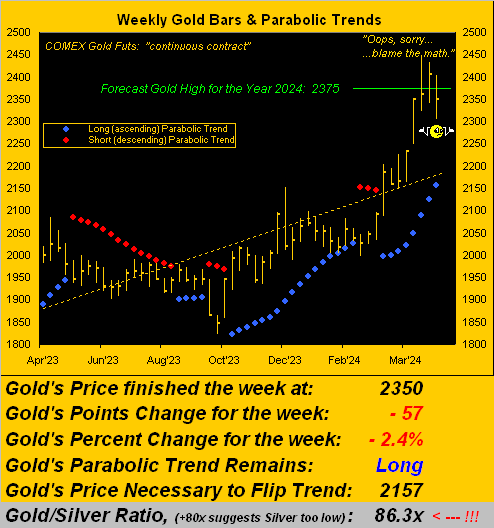
And as Gold indeed is “What’s Happenin’!”, let’s go to the weekly bars from one year ago-to-date, wherein we see the blue-dotted parabolic Long trend now eight weeks in duration. Moreover, in spite of last Monday’s price falter, Gold has since tread water by closing well off the week’s low (2304) per the closing nub (2350) on the rightmost bar:
Here comes the however: the near-term “math” suggests we’ll see lower levels still. For instance, we’ve the following two-panel display. On the left is a graphic with which by now you’ve become quite familiar: ’tis our BEGOS Markets near-term valuation (smooth line) for Gold based on its price movements relative to the other four primary BEGOS components (Bond, Euro, Oil, S&P). And at present per the lower left section, price is still better than +100 points above valuation. On the right we’ve Gold’s daily “candles” for the past 21 trading days (one month) wherein we find the parabolics having flipped to Short (per the red-encircled dot of last Monday). Such flip was anticipated in last week’s missive — (“Too from the technical tent, Gold…is approaching a flip of the daily parabolic measure from Long to Short”) — and so it came to pass:
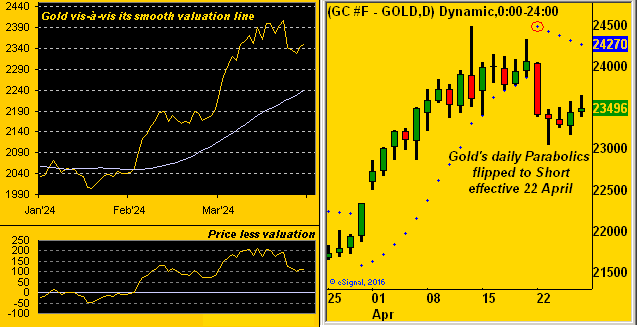
In terms of how far further Gold may fold from here, the 2247-2171 zone appears structurally supportive, (i.e. a drop from here of another -100 points wouldn’t be untoward). And that technically trues up nicely per the above graphic wherein price is just over +100 points above valuation. See how easy this is? (Hopefully we’re wrong and Gold simply zooms back up the road).
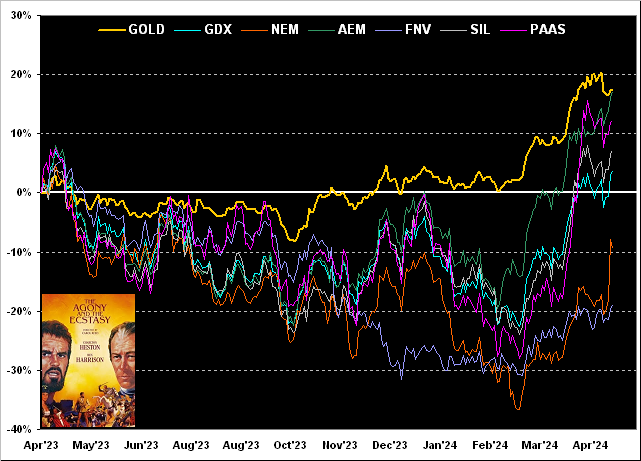
Meanwhile: “How ’bout ‘dem miners!” Long overdue to get on the move, so have they been doing of late, albeit they too shall deflate should Gold near-term further slip from “Great!”. Indeed here’s our usual month-end chart of Gold’s year-over-year daily percentage track along with those of its key equities brethren. From worst-to-first we’ve: Franco-Nevada (FNV) -19%, Newmont (NEM) -9% (but sporting a very robust, earnings-induced up move this past week), the VanEck Vectors Gold Miners exchange-traded fund (GDX) +4%, the Global X Silver Miners exchange-traded fund (SIL) +7%, Pan American Silver (PAAS) +12%, Agnico Eagle Mines (AEM) +17%, and Gold itself +18%. As we go to the graphic, let us — for the equities — appropriately cue “The Agony and the Ecstasy”, –[Heston, Harrison, 20th Century Fox, ’65]:
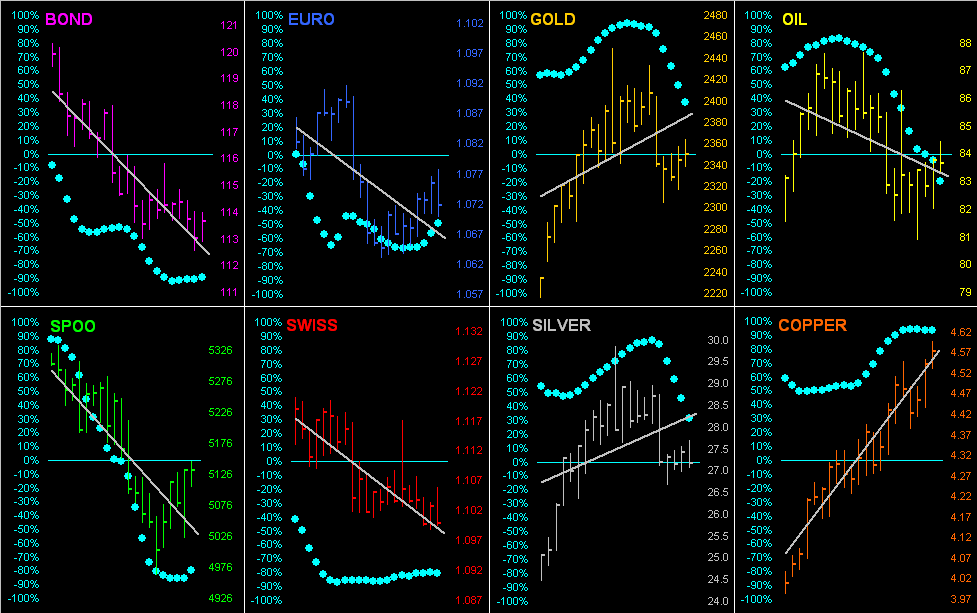
Next we go ’round the horn across the past 21 trading days for all eight BEGOS components. The “Baby Blues” therein reflect the day-to-day consistency of each market’s respective grey trendline. And as noted in yesterday’s Prescient Commentary, there’s the old adage “Follow the Blues instead of the news, else lose your shoes”, which specific below to both Gold and Silver is yet another technical case for further price fallout near-term. But does that in turn mean we buy the Euro, its dots curling upward? Given the Federal Open Market Committee’s pending “do nothing” Policy Statement and Powell Presser (on Wednesday, 01 May), any “hint” of a rate cut delay (if not outright suggestion of a rate hike), ought only serve to further strengthen the Dollar:
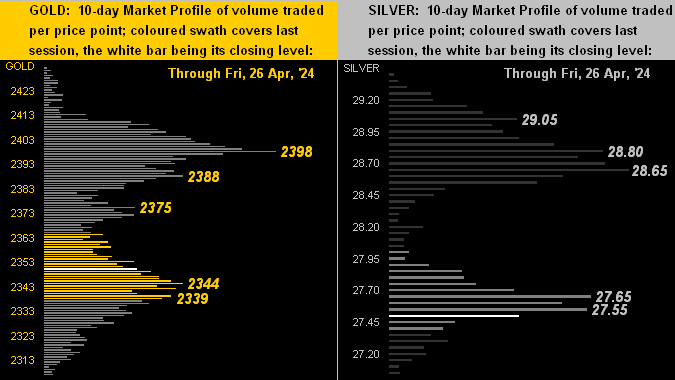
Moving on to the 10-day Market Profiles for the precious metals, we’ve Gold (at left) and Silver (at right). Simply per this construct, there is quite a bit of overhead volume resistance with which to deal. Those prices levels of volume domination are as labeled:
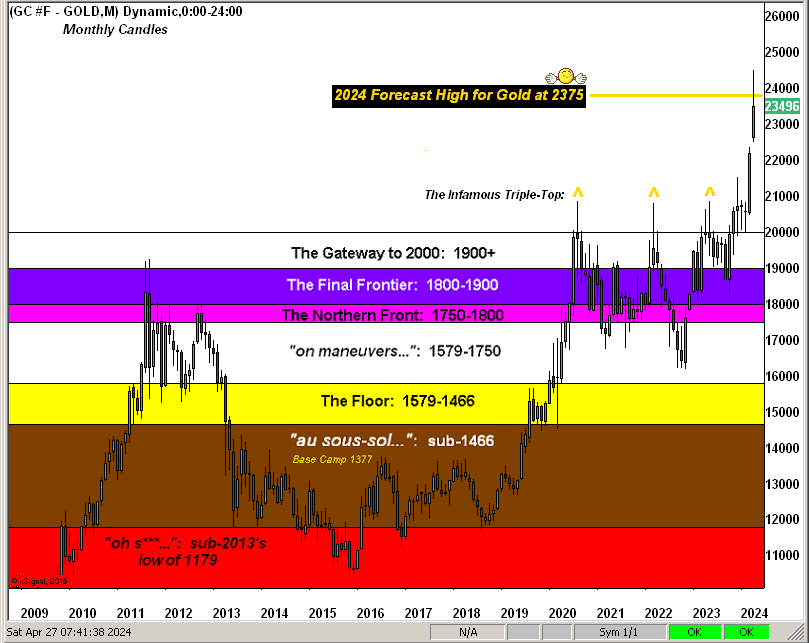
And of course it being month-end (save for two trading days), here we’ve Gold’s structure across the past 16 years. Note the forecast high (2375) having been achieved (and then some), followed by price’s pullback. Still, we’ve added scaling space up toward 2600, just in case, (wink wink, nudge nudge…):
As for the StateSide Economic Barometer, the two most eyed items of the past week were the first peek at Q1 Gross Domestic Product and March’s Personal Consumption Expenditures. First to the GDP: its annualized nominal Q1 growth rate was +4.7% … but … +3.1% of such growth was pure inflation so the … net … real GDP growth was at best a tepid +1.6%. Again, can you state “stagflate“?
Second to the “Fed-favoured” PCE for March: both the headline and core readings maintained their +0.3% February paces, which when annualized comes to +3.6%, (nearly double the Fed’s targeted +2.0%). Can you say “raise“? Nevertheless, March’s Home Sales (both New and Pending) improved, as did Personal Income and Durable Orders, the Baro in turn getting a boost:
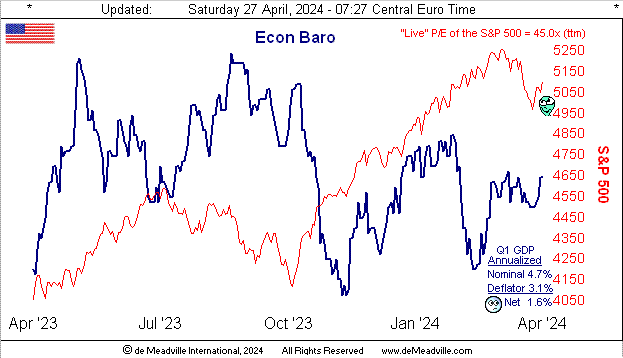
Notwithstanding our ever-ongoing aforementioned misgivings about the terrifically overvalued stock market as measured by the S&P (aka “Casino”) 500, note in the Baro the “live” price/earnings ratio is now 45.0x (by trailing twelve months) which as we near the half-way mark of Q1 Earnings Season hasn’t — on a cap-weighted basis — declined a material wit, (’twas 46.1x at the start of Earnings Season).
Yes, some 64% of S&P constituents have thus far reported year-over-year earnings increases: but that impossibly supports a P/E of such level, indeed nearly double that of a dozen years ago. Also, the “all-risk” Casino’s yield is now 1.413% versus the “no-risk” annualized U.S. three-month T-Bill’s 5.238%. And yet the week was replete with such FinMedia headlines as (hat-tip Bloomy) –> “Magnificent Seven Roar…”, “Big Tech Surges…” and “AI Craze Powers Best Week…” Thus the great game of “Equities Chicken” continues.
Oooh, and we shan’t then close without mentioning this from the “Which Came First? The Chicken or the Egg? Dept.” (Hat-tip NewsMax) –> Engineers from The University of Colorado “Go Buffs!” at Boulder have conclusive research that folks over the age of 65 tend to slow down as it takes more energy to move than it does those younger. Which has us seriously considering a new career in the field of such paid-for research of obvious conclusion.
Either way conclusively, don’t you be a chicken: use our weekly research to buy and hold Gold!

Cheers!
…m…
www.TheGoldUpdate.com
www.deMeadville.com
and now on “X”: @deMeadvillePro
About the author
