
Gold recently made a very important breakout around March, when it smashed through some key levels. This breakout is even more important when considered in the context of other important indicators that show of the coming collapse of the current monetary order.
Not only is gold in a bull run, but it has entered the phase which can be compared to a bank run (as previously explained) on the world financial system, with the US dollar financial system acting as the world banker.
Below, is a long-term chart for gold:
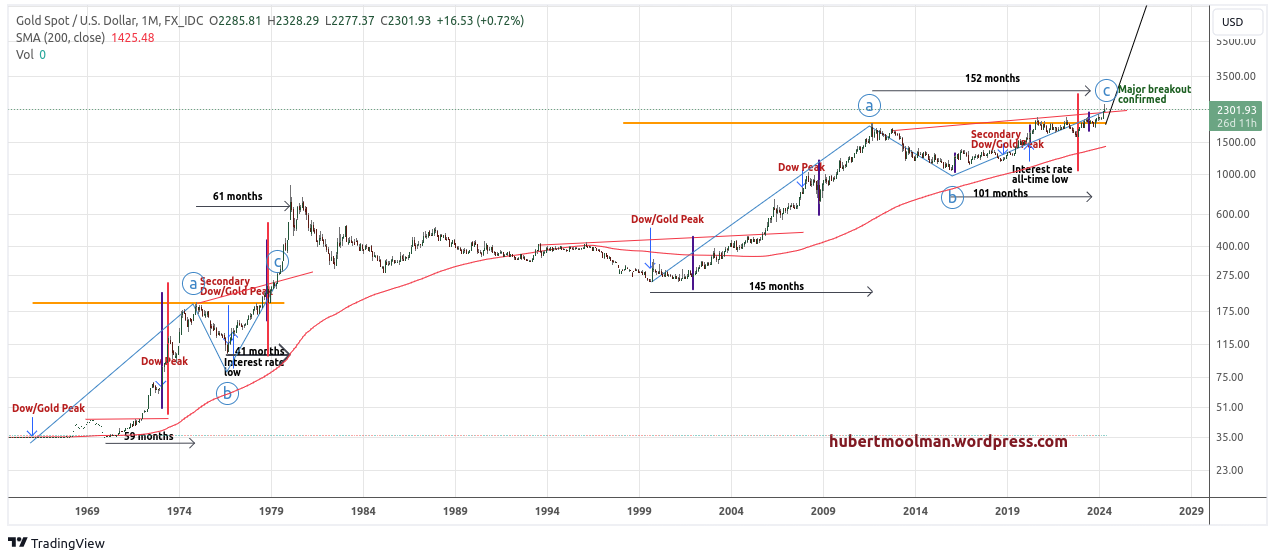
I have marked out two patterns that show how the recent breakout puts gold in the acceleration phase of the bull market.
Both patterns start at the Dow/Gold ratio peak (1966 and 1999 respectively). After the Dow/Gold ratio peaks, gold went on strong bull run, which continued even after the 1973 and 2007 Dow peaks, respectively.
After the peaks at point a, the chart formed a cup-type pattern. During this consolidation (the cup) there was a secondary Dow/Gold peak and also interest rates made an important low.
The structure of the 70s pattern was such that after the bottom (point b) during the cup phase, price moved relatively slowly up at first, but once it broke out at the red line it moved up quite fast. Even current geopolitical risks (as they relate to the US dollar) suggest that this is plausible.
The current pattern could be following that same type of progression. The move since the low of the cup phase (point b) has been slow, and now that price finally broke out at the red line, we could see an accelerated increase in price (of course we are probably seeing some sort of retest or consolidation before the accelerated move higher).
Warm regards,
Hubert Moolman